Advertising, Amazon, Amazon PPC, Ecommerce, Pay per click
𝐔𝐊 𝐨𝐯𝐞𝐫 𝐭𝐡𝐞 𝐥𝐚𝐬𝐭 14 𝐝𝐚𝐲𝐬 𝐰𝐚𝐬𝐧’𝐭 𝐚𝐛𝐨𝐮𝐭 𝐬𝐩𝐞𝐧𝐝𝐢𝐧𝐠 𝐦𝐨𝐫𝐞 𝐢𝐭 𝐰𝐚𝐬 𝐚𝐛𝐨𝐮𝐭 𝐬𝐩𝐞𝐧𝐝𝐢𝐧𝐠 𝐰𝐢𝐭𝐡 𝐩𝐮𝐫𝐩𝐨𝐬𝐞.
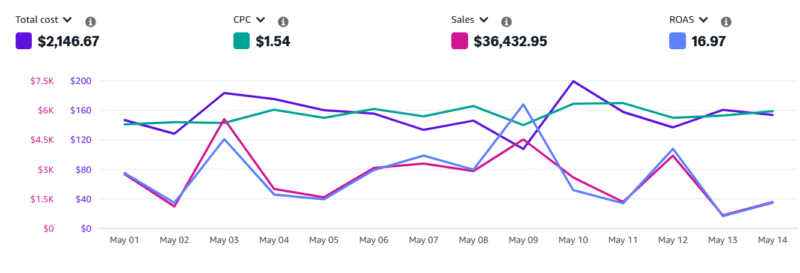
$2,146.67 in ad spend.
$36,432.95 in sales.
16.97 ROAS.
At first glance, the chart looked like a rollercoaster.
Sharp rises. Sudden drops. Momentum shifting every few days.
But behind the fluctuations, there was a bigger story unfolding.
𝐓𝐡𝐢𝐬 𝐰𝐚𝐬𝐧’𝐭 𝐚𝐧 𝐚𝐜𝐜𝐨𝐮𝐧𝐭 𝐜𝐡𝐚𝐬𝐢𝐧𝐠 𝐞𝐯𝐞𝐫𝐲 𝐜𝐥𝐢𝐜𝐤.
It was an account learning where growth actually lives.
Some days delivered strong spikes.
Others looked quieter than expected.
Yet performance kept finding its way back.
Early momentum created confidence
Mid-cycle shifts tested the strategy
Late recoveries proved the system was resilient
𝐓𝐡𝐢𝐬 𝐢𝐬 𝐰𝐡𝐚𝐭 𝐫𝐞𝐚𝐥 𝐀𝐦𝐚𝐳𝐨𝐧 𝐏𝐏𝐂 𝐬𝐜𝐚𝐥𝐢𝐧𝐠 𝐥𝐨𝐨𝐤𝐬 𝐥𝐢𝐤𝐞:
Not perfect graphs.
Not nonstop upward trends.
But smart decisions repeated consistently.
Because profitable growth isn’t built by reacting to every dip.
It’s built by understanding the story hidden inside the data.
𝐔𝐊 𝐭𝐡𝐢𝐬 𝐦𝐨𝐧𝐭𝐡 𝐰𝐚𝐬 𝐚 𝐫𝐞𝐦𝐢𝐧𝐝𝐞𝐫:
Results improve when strategy becomes stronger than emotions.
𝐓𝐡𝐞 𝐫𝐞𝐚𝐥 𝐪𝐮𝐞𝐬𝐭𝐢𝐨𝐧 𝐢𝐬:
When performance fluctuates… do you panic, or do you optimize