Advertising, Amazon, Amazon PPC, Ecommerce, Pay per click
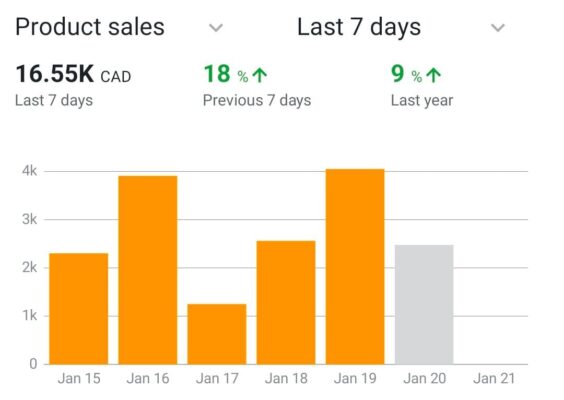
$16.5K in 7 days. 18% week-over-week growth. 9% year-over-year.
Not bad for January in Canada.
Most sellers panic when they see volatility in their sales chart.
I see opportunity.
Look at this snapshot closely:
- Jan 16: Peak day at ~$4K (holiday weekend traffic carryover)
- Jan 17: Drop to ~$1.2K (typical mid-week dip)
- Jan 19: Bounced back to ~$4K (weekend recovery pattern)
The pattern isn’t random. It’s predictable.
Here’s what most Amazon sellers miss:
❌ They judge performance by single-day sales
❌ They panic when one day drops 70%
❌ They miss the weekly trend (which is up 18%)
✅ Smart sellers track 7-day rolling averages
✅ They compare same period last year (up 9%)
✅ They optimize for weekly momentum, not daily spikes
The reality:
If you’re growing 18% week-over-week in January (historically the slowest month), you’re outperforming 80% of Amazon sellers right now.
Question for Amazon sellers:
What’s your week-over-week growth rate right now? Drop it below—let’s see who’s winning Q1. 👇
Why this works:
✅ Opens with strong numbers ($16.5K, 18%, 9%)
✅ Breaks down the chart pattern (teaches + engages)
✅ Contrasts amateur vs pro seller mindset
✅ Positions January growth as exceptional (scarcity angle)
✅ Ends with benchmark question (high engagement driver)