Advertising, Amazon, Amazon PPC, Ecommerce, Pay per click
𝐒𝐨𝐦𝐞 𝐝𝐚𝐬𝐡𝐛𝐨𝐚𝐫𝐝𝐬 𝐭𝐞𝐥𝐥 𝐧𝐮𝐦𝐛𝐞𝐫𝐬.
Some dashboards tell a story.
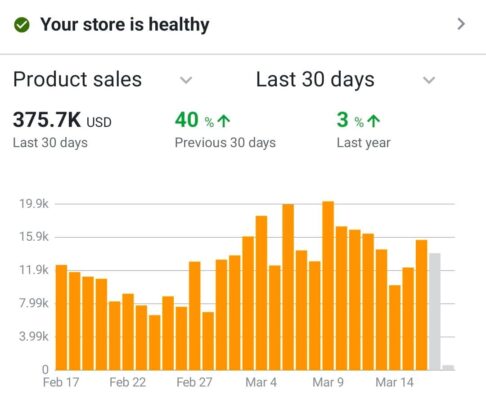
𝐓𝐡𝐢𝐬 𝐨𝐧𝐞 𝐭𝐞𝐥𝐥𝐬 30 𝐝𝐚𝐲𝐬 𝐨𝐟 𝐦𝐨𝐦𝐞𝐧𝐭𝐮𝐦.
At the start of the month, sales were steady. Nothing extraordinary. Just consistent movement.
Then something shifted.
Data started revealing patterns.
Customer demand started building.
The right optimizations started compounding.
𝐃𝐚𝐲 𝐛𝐲 𝐝𝐚𝐲, 𝐭𝐡𝐞 𝐛𝐚𝐫𝐬 𝐜𝐥𝐢𝐦𝐛𝐞𝐝 𝐡𝐢𝐠𝐡𝐞𝐫.
$375.7K in sales in the last 30 days
40% growth compared to the previous 30 days
⬆ 3% growth compared to last year
But the interesting part isn’t the number.
It’s how momentum works in ecommerce.
Growth rarely happens in a straight line.
Some days dip.
Some days spike.
But when the 𝐬𝐭𝐫𝐚𝐭𝐞𝐠𝐲, 𝐥𝐢𝐬𝐭𝐢𝐧𝐠𝐬, 𝐚𝐧𝐝 𝐚𝐝𝐯𝐞𝐫𝐭𝐢𝐬𝐢𝐧𝐠 𝐚𝐥𝐢𝐠𝐧, small improvements stack until the graph starts climbing.
That’s when the real flywheel begins.
𝐓𝐡𝐞 𝐥𝐞𝐬𝐬𝐨𝐧?
Ecommerce success is rarely about one viral day.
𝐈𝐭’𝐬 𝐚𝐛𝐨𝐮𝐭 30 𝐝𝐚𝐲𝐬 𝐨𝐟 𝐜𝐨𝐧𝐬𝐢𝐬𝐭𝐞𝐧𝐭 𝐨𝐩𝐭𝐢𝐦𝐢𝐳𝐚𝐭𝐢𝐨𝐧, 𝐭𝐞𝐬𝐭𝐢𝐧𝐠, 𝐚𝐧𝐝 𝐬𝐜𝐚𝐥𝐢𝐧𝐠.
And when that happens
The numbers start telling their own story.