Advertising, Amazon, Amazon PPC, Ecommerce, Pay per click
Last 30 Days. Real Data. Real Growth.
When I review a 30-day performance graph, I don’t just see spikes and dips.
I see behavior.
I see patterns.
I see opportunities.
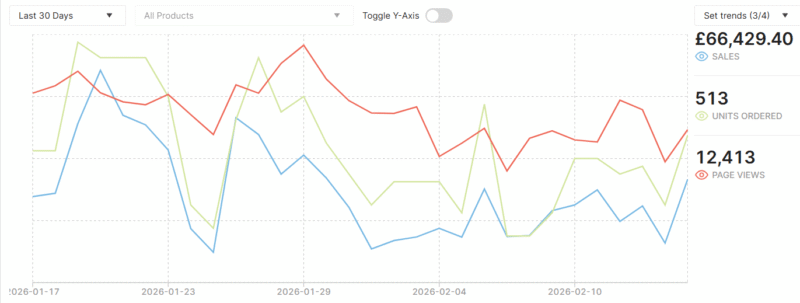
Here’s what the last 30 days delivered:
£66,429.40 in Sales
513 Units Ordered
12,413 Page Views
Now let’s look beyond the headline numbers.
There were strong peak days where demand surged and conversions aligned perfectly. There were slower periods where traffic dipped and required quick adjustments. Instead of reacting emotionally, we responded strategically.
We monitored:
• Conversion consistency
• Traffic quality vs. quantity
• Sales velocity trends
• Daily performance shifts
• Optimization opportunities inside campaigns
12,000+ page views tell me visibility is strong.
513 units tell me buyers trust the offer.
£66K+ in revenue tells me the structure is working.
Growth over 30 days isn’t about one viral spike. It’s about building a system that performs even when the market fluctuates.
Stable foundations create scalable results.
When performance is predictable, scaling becomes controlled not risky.
The real win isn’t just revenue.
It’s clarity. It’s structure. It’s knowing why sales are happening and how to repeat them.
Month closed strong.
Momentum secured.
Now we optimize, refine, and push for the next level.