Advertising, Amazon, Amazon PPC, Ecommerce, Pay per click
We Made SAR 10,270 in 7 Days. Here’s Why I’m Worried.
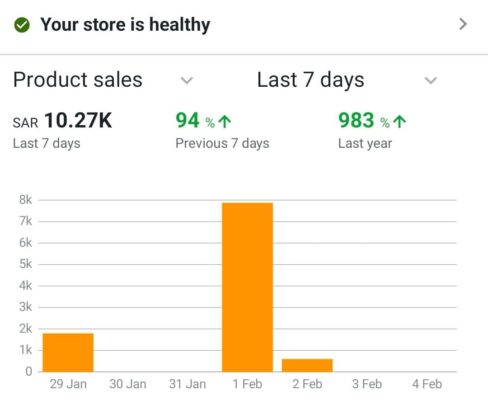
Most sellers would celebrate this screenshot.
SAR 10.27K in sales (Last 7 days)
94% growth vs. previous week
983% YoY growth
But look closer at the graph. SAR 7,900 came from ONE day (Feb 1st).
Then it crashed to nearly zero.
This isn’t growth. It’s a ticking time bomb.
HERE’S WHAT THIS GRAPH IS REALLY TELLING YOU:
1. YOU DON’T HAVE A BUSINESS YOU HAVE A SLOT MACHINE
Jan 29: SAR 1,800 (decent)
Jan 30-31: SAR 0 (crickets)
Feb 1: SAR 7,900 (jackpot!)
Feb 2: SAR 500 (back to reality)
Feb 3-4: SAR 0 (silence)
If you can’t explain why Feb 1st exploded, you can’t replicate it. And if you can’t replicate it, you’re gambling—not building.
Possible culprits:
- Lightning Deal went live
- Competitor stockout
- Influencer mention
- Seasonal event (Saudi National Day? Payday spike?)
- Amazon algorithm glitch
The danger: You optimize your entire strategy around Feb 1st data… then it never happens again.
2. THIS SPIKE JUST DESTROYED YOUR INVENTORY PLANNING
Scenario:
- Feb 1: You sell 80 units (amazing!)
- Feb 2-4: You sell 5 units total
- Your reorder calculation: Based on Feb 1’s velocity, you order 500 units
- Reality: You now have 90 days of dead inventory eating storage fees
The fix: Remove outliers. Calculate your baseline daily sales (median, not average). Plan inventory around that—not your best day.
3. YOUR PPC DATA IS NOW USELESS
Feb 1 ACoS: 6% (hero!)
Feb 2-4 ACoS: 52% (villain!)
What changed? Nothing. Your campaigns didn’t suddenly get worse.
The spike artificially inflated your sales, making your ad spend look efficient. So you increased bids… then got crushed when sales returned to normal.
The lesson: Never make PPC decisions based on single-day data. Use 14-day rolling averages minimum.
4. YOU’RE ONE STOCKOUT AWAY FROM BSR COLLAPSE
Let’s say Feb 1’s spike depleted your inventory by Feb 5th.
What happens next:
- Days 1-3 of stockout: Amazon lowers your ranking slightly
- Days 4-7: You disappear from Page 1
- Days 8-14: Competitors steal your reviews, rankings, and customers
- Day 15: You restock… but you’re now on Page 5
It takes 30 days to recover from a 7-day stockout.
That SAR 7,900 “win” just cost you SAR 30,000 in lost February sales.
WHAT HEALTHY GROWTH ACTUALLY LOOKS LIKE:
Option A (Volatile—Your Current State):
- Feb 1: SAR 7,900
- Feb 2-7: SAR 2,370 combined
- Total: SAR 10,270
- Stress level: 10/10
- Sustainability: 0%
Option B (Stable—The Goal):
- Feb 1: SAR 1,450
- Feb 2: SAR 1,480
- Feb 3: SAR 1,520
- Feb 4: SAR 1,550
- Feb 5: SAR 1,600
- Feb 6: SAR 1,630
- Feb 7: SAR 1,670
- Total: SAR 10,900
- Stress level: 2/10
- Sustainability: 100%
Same revenue. Totally different business.
THE METRICS THAT ACTUALLY MATTER:
❌ Week-over-week % growth (misleading with spikes)
✅ Median daily sales (removes outliers)
❌ Best day revenue (lottery ticket thinking)
✅ Worst day revenue (shows your floor)
❌ Total sales (vanity metric)
✅ Days of inventory left (survival metric)
❌ ACoS on best days (false confidence)
✅ TACoS over 30 days (full picture)
❌ YoY % growth (983% means nothing if last year was SAR 10/week)
✅ Monthly profit after all costs (only number that feeds your family)
WHAT I’D DO IF THIS WAS MY STORE:
Week 1 (Investigate):
- Pull Feb 1st search term reports (what drove the spike?)
- Check Buy Box % (did we own it 100% that day?)
- Review competitor inventory (did 3 rivals go OOS?)
- Analyze traffic sources (external surge? TikTok? Google?)
Week 2 (Stabilize):
- Set inventory reorder alerts at median sales × 45 days, not peak sales
- Adjust PPC bids based on 14-day averages, not single days
- Create “spike protocol” (what to do when sales 3x overnight)
Week 3 (Replicate—If Possible):
- If spike was from a deal → schedule monthly Lightning Deals
- If spike was from traffic → invest in that channel
- If spike was luck → ignore it and focus on baseline growth
THE BOTTOM LINE:
I’d rather have:
- SAR 1,500/day for 30 days = SAR 45,000/month
- Predictable inventory needs
- Stable PPC performance
- Zero stress
Than:
- SAR 10,000 one week, SAR 2,000 the next
- Constant stockouts
- Emotional rollercoaster
- Burnout by Q2
Boring consistency beats exciting chaos.
Every. Single. Time.
YOUR TURN: WHICH GRAPH IS YOURS?
Comment with:
- 🎢 if your sales look like a rollercoaster (I’ll help you stabilize)
- 📈 if you’ve built smooth, predictable growth (share your secret!)
- 🔥 if you think volatility is fine (let’s debate!)